About the Data
Project Motivation
Self-initiated mini project to learn practical SCM problem-solving using open-source data. The goal: understand ABC-FSN analysis hands-on and build the skill to apply it to real inventory scenarios.
This analysis uses open-source grocery data to answer four key questions:
- What is the data all about?
- What SCM analyses can be performed on this data?
- How does the data represent results visually?
- How do we interpret the findings for action?
What is ABC-FSN Analysis?
ABC Classification
Classifies products by monetary value (revenue contribution). A = High Value, B = Medium Value, C = Low Value. Focuses inventory investment on what matters most.
FSN Classification
Classifies products by movement rate (quantity sold). F = Fast Moving, S = Slow Moving, N = Non-Moving. Identifies stock velocity for smarter replenishment.
Combined Matrix
Combining both dimensions creates a 3×3 matrix — 9 strategic zones. Each zone calls for a different inventory management approach.
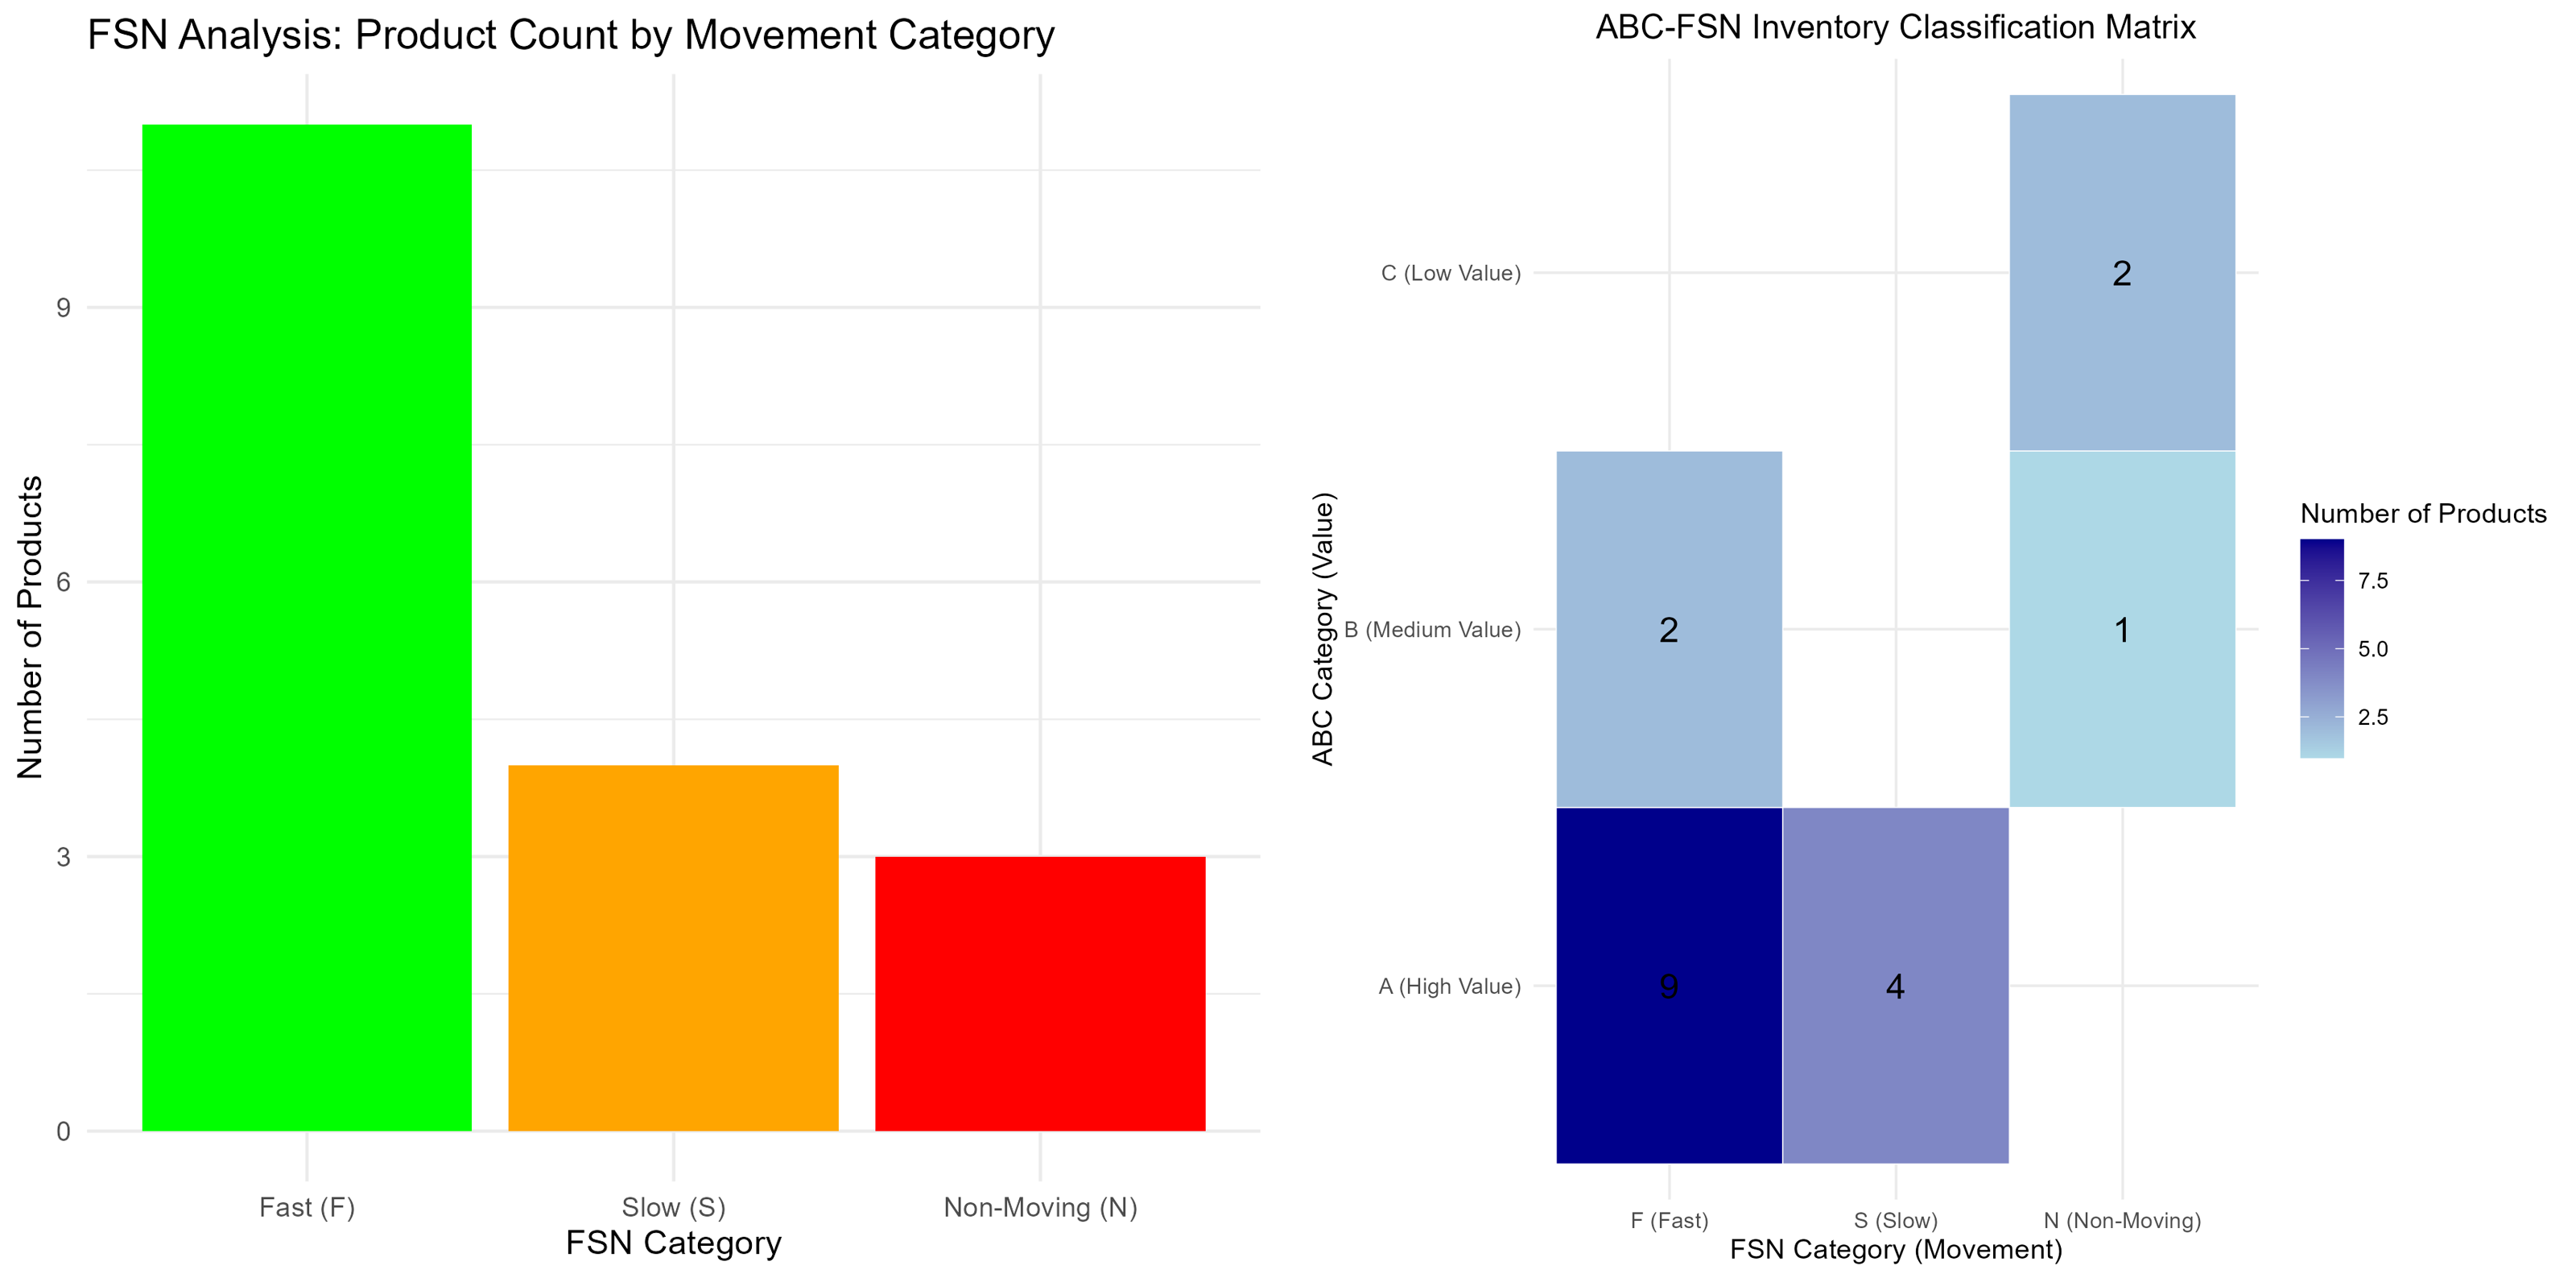
Results — ABC-FSN Matrix
The final outcome is a heatmap showing the count of products in each of the nine categories. Darker shades indicate higher product concentration.
Axis Key
| Axis | Classification | Criteria |
|---|---|---|
| Y-Axis (Rows) | ABC (A, B, C) | Based on Revenue (final_amount). A = High, B = Medium, C = Low Value |
| X-Axis (Columns) | FSN (F, S, N) | Based on Quantity Sold. F = Fast Moving, S = Slow Moving, N = Non-Moving |
Matrix Summary
| ABC \ FSN | F (Fast) | S (Slow) | N (Non-Moving) |
|---|---|---|---|
| A (High Value) | 9 | 4 | 0 |
| B (Medium Value) | 2 | 0 | 1 |
| C (Low Value) | 0 | 0 | 2 |
Inventory Strategy by Category
| Cell | Classification | Count | Strategic Implication |
|---|---|---|---|
| AF | High Value, Fast Moving | 9 | 🚨 Critical Focus. Money-makers and top sellers. Implement strict control, accurate forecasting, JIT inventory, and minimum safety stock. |
| AS | High Value, Slow Moving | 4 | ⚠️ Monitor Carefully. High monetary investment, slow sales. Management-level attention required; check for obsolescence risk. |
| AN | High Value, Non-Moving | 0 | ✅ Ideal (none here). If any fell here, immediate promotion or liquidation would be required. |
| BF | Medium Value, Fast Moving | 2 | 🔁 Routine Control. Use standard ROP and EOQ. Automate where possible; review periodically. |
| BS | Medium Value, Slow Moving | 0 | 👀 Watch Closely. Periodic review needed; evaluate promotion or downgrade to C-level control. |
| BN | Medium Value, Non-Moving | 1 | 🏷️ Promotion Candidate. Moderate value in stagnant stock; consider minor discounts to clear. |
| CF | Low Value, Fast Moving | 0 | 📦 Simplified Control. Low-cost, high-volume staples. Use visual control or two-bin systems. |
| CS | Low Value, Slow Moving | 0 | 🔓 Loose Control. Minimal effort needed; may be seasonal stock. |
| CN | Low Value, Non-Moving | 2 | 🗑️ Phase Out. Clear, dispose, or discontinue to free warehouse space and reduce admin effort. |
Final Decisions
Key Takeaways
Concentrate on the 9 AF products (e.g., Tomatoes, Bread, Chicken Breast) — these are the primary revenue drivers where stockouts are most costly. Phase out the 2 CN products (e.g., Ground Beef, Carrots) that occupy space without contributing meaningful revenue. The ABC-FSN matrix enables item-specific, targeted strategies that lower inventory costs, reduce stockouts, and improve working capital.