About the Project
This project is a fully self-built AI-powered Supply Chain Management Analyst — a desktop application that lets you load any CSV dataset and have a natural language conversation with your data using Llama 3.1, running entirely on your local machine via Ollama. No API keys, no internet connection, no cloud. Your data stays private.
The motivation behind this project was to go beyond static dashboards and explore how Large Language Models (LLMs) can be embedded into real-world analytical workflows. As a Supply Chain professional, I wanted a tool that a non-technical manager could open, upload a CSV, and immediately get intelligent insights — without writing a single line of code.
100% Local — No Data Leaves Your Machine
Llama 3.1 runs on your hardware via Ollama. No data is sent to OpenAI, Anthropic, or any cloud provider. This is a key advantage for enterprise SCM environments where data confidentiality is non-negotiable.
Tech Stack
Built entirely in Python using open-source tools. The stack was chosen to maximise performance on consumer hardware while keeping setup simple — a single pip install and ollama pull is all that's needed.
How It Works
The agent follows a straightforward pipeline: the user uploads a CSV file, which Pandas parses into a dataframe. A statistical summary is automatically compiled and injected into the system prompt sent to Llama 3.1. The model reasons over this context and returns insights in natural language, streamed token-by-token back into the chat UI.
All processing happens locally. NiceGUI handles the real-time browser-based UI on localhost:8080. Plotly renders interactive charts on the fly, and a linear regression model powers the demand forecasting panel.
Key Features
AI Chat Interface
Ask Llama 3.1 anything about your loaded dataset in plain English. The agent understands SCM-specific queries: profitability, demand patterns, supplier ranking, margin analysis, and more.
Auto KPI Dashboard
On file load, the agent automatically detects numeric columns and generates KPI stat cards — total revenue, order counts, average values — with zero manual configuration required.
Data Explorer
Select any two columns and chart type (bar, line, scatter) to instantly generate interactive Plotly visualisations — designed for ad-hoc exploratory analysis with no code.
Demand Forecasting
Select any numeric metric and run a linear regression forecast. The agent projects future values and plots the trend line alongside historical data for quick planning decisions.
Supplier Scorecards
The sidebar automatically generates per-supplier performance cards with spend, order count, performance scores, and colour-coded risk badges (Reliable / Watch / At Risk).
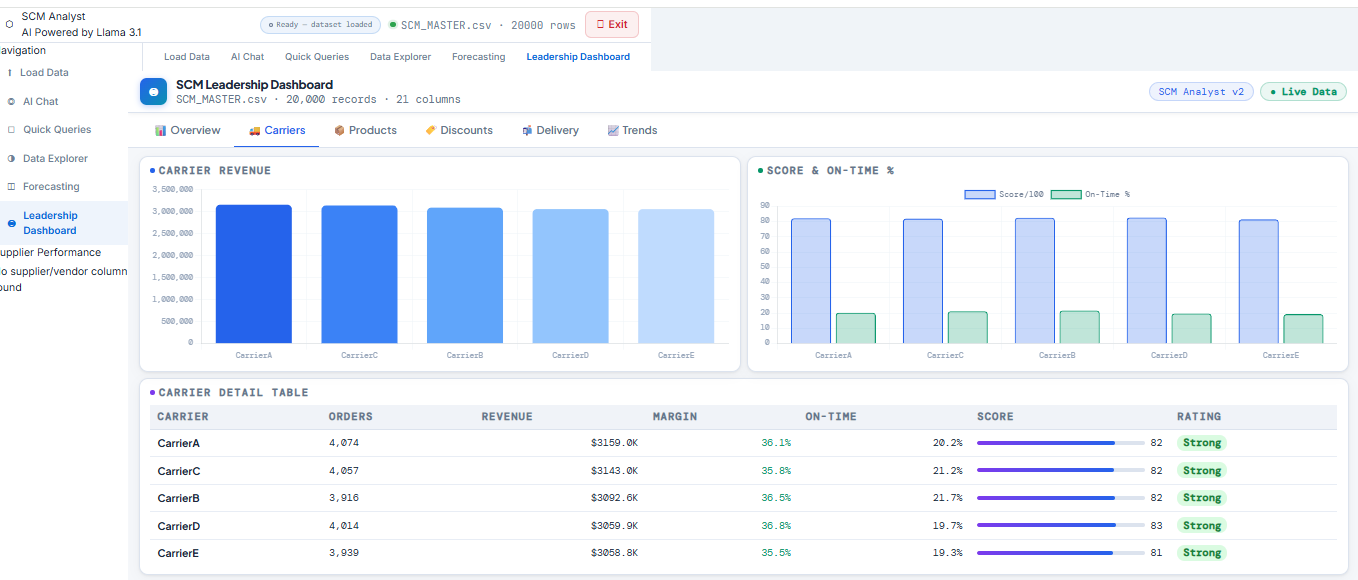
Pre-built SCM Queries
A panel of pre-built questions (most profitable products, discount impact, top suppliers, demand trends) that fire instantly against your data — ideal for leadership-ready summaries.
What I Learned
This project pushed me into territory well beyond standard data analysis. Building a local LLM application required understanding prompt engineering, async token streaming, and stateful multi-panel UI design in Python. Key learnings include:
- Prompt engineering for domain-specific LLM reasoning (SCM context injection)
- Asynchronous streaming with
asyncioandthreading.Queuefor real-time chat - Building reactive UIs with NiceGUI and handling live state across panels
- Linear regression forecasting with Plotly visualisation integration
- Designing a production-quality UI/UX in pure Python — no HTML/CSS/JS required
- Packaging a local LLM app for non-technical end users with a one-command startup
View the Code
The full source code is available on GitHub. To run it locally, you'll need Python 3.11+, Ollama installed, and the Llama 3.1 model pulled. Full setup instructions are in the repository README.