Excel — Fast Food Sales Analysis
Project Objective
Utilise advanced Excel features to analyse and visualise fast food sales data from an open-source dataset — showcasing VLOOKUP, TEXT functions, IF logic, Pivot Tables, and dynamic charts.
Analysis Questions
What is the data about?
Two sheets containing order IDs and menu information — linked using VLOOKUP to consolidate into a single analytical view.
How can data be categorised?
By cuisine type (Italian, Asian, Mexican, American), time of day (lunch vs dinner), and day of week (weekday vs weekend).
Any dependencies?
Sales volume strongly correlates with cuisine category and day of week — Italian dominates, and Sundays peak at 299 orders.
What is the outcome?
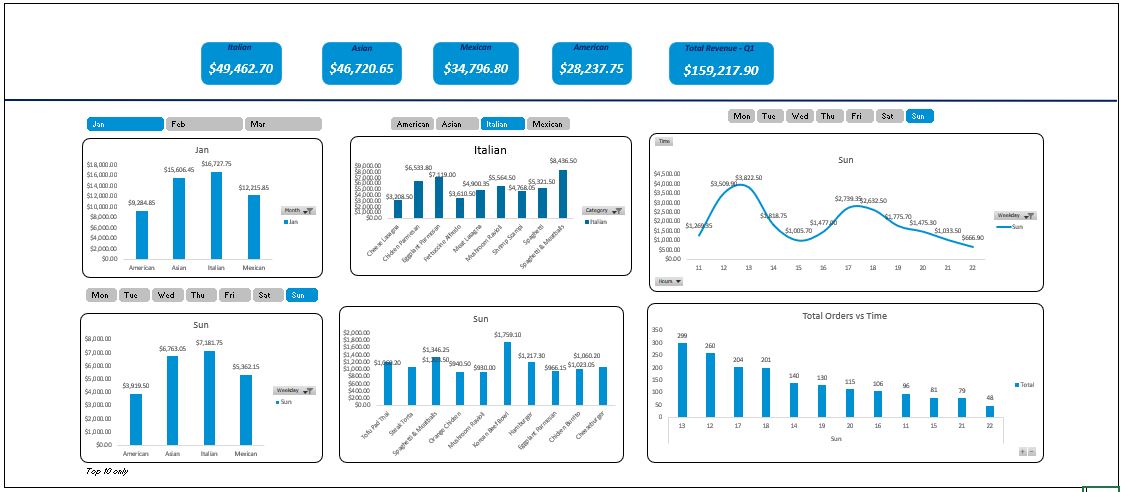
A fully interactive pivot-table dashboard with dynamic charts summarising Q1 performance across all dimensions.
Results — Q1 (Jan, Feb & March)
$159,217
Total Q1 Sales
4
Cuisine Categories
299
Peak Sunday Orders
#1
Italian Cuisine
Key Findings
- Cuisine Ranking: Italian > Asian > Mexican > American by total revenue.
- Top Product: Spaghetti & Meatballs topped the chart within Italian cuisine across Top 10 sold items.
- Weekend Peak: Sundays had the highest order volume (299 orders). Italian dominated weekend sales too.
- Weekday Pattern: Lunch hours (12–1 PM) drove the highest weekday sales activity.
- Seasonal Boost: New Year's Eve and other holidays contributed significantly to Q1 revenue.
Excel Techniques Used
VLOOKUP / XLOOKUP
TEXT Functions
IF / IFS Logic
Pivot Tables
Dynamic Charts
Data Validation